
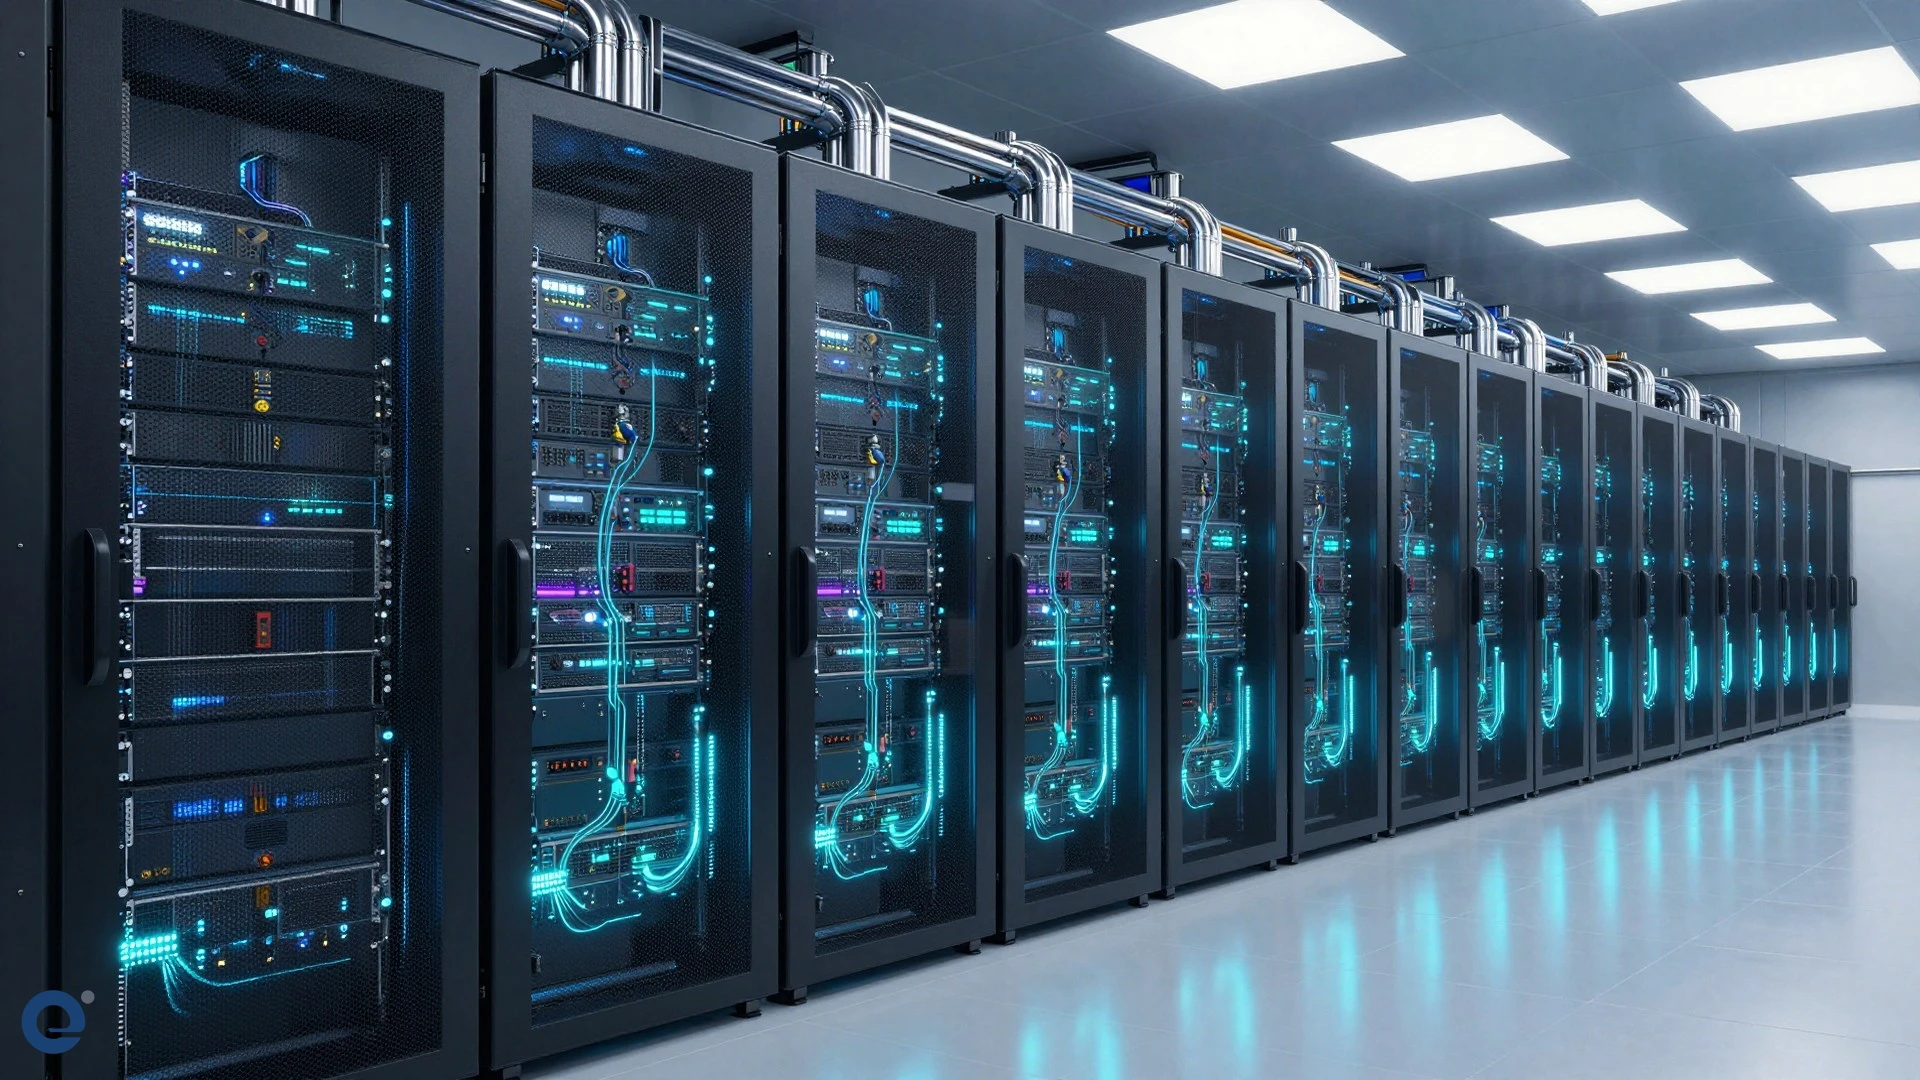
A single uncorrected memory bit-flip during a multi-week LLM training run can collapse an entire 10,000-GPU cluster. When distributed training jobs crash mid-epoch, enterprise infrastructure teams lose far more than compute time. They suffer idle power draw, lost engineering cycles, and expensive data recovery pipelines. Traditional infrastructure monitoring tools trigger alerts only after hardware thresholds breach operational limits[1]. By that point, the system is already down, and cluster checkpoint resynchronization costs thousands of dollars per incident.
Modern high-density AI data centers operate under unprecedented thermal dynamics and transient power loads. Standard infrastructure health metrics cannot capture subtle voltage micro-droops or PCIe interconnect degradation prior to complete system collapse. Engineering teams require an active strategy that anticipates failure long before silicon thermal limits trigger emergency shutoffs[2]. Deploying dynamic monitoring methodologies bridges the critical gap between reactive alerting and continuous workload stability.
This article establishes how shifting to predictive maintenance through EONSR monitoring safeguards AI hardware investments. Relying on reactive alerting guarantees costly downtime. Enterprise teams must adopt continuous, telemetry-driven health scoring to protect cluster uptime and maximize hardware lifespan. By analyzing micro-level system anomalies, modern operations teams transform fragile compute environments into resilient, optimized processing engines[3].
The hidden financial tax of reactive compute failure in deep learning workloads
Reactive infrastructure monitoring acts as an expensive illusion of security for AI operations. Enterprise teams often assume standard node monitoring protects their multi-million-dollar clusters. However, traditional monitoring frameworks check basic metrics like CPU utilization or fan speed at coarse intervals. In massive parallel workloads, hardware degradation builds up quietly across microsecond intervals long before standard software monitors flag an anomaly.
Quantifying the compound cost of cluster training restarts
When a GPU node drops unexpectedly during a distributed training run, the entire cluster halts immediately. All participating nodes must wait for fault isolation software to remove the damaged hardware. Once isolated, the engineering team must re-spin the job from the last valid state checkpoint. This recovery process consumes massive operational bandwidth and enterprise compute hours.
A single cluster restart cycle incurs direct financial penalties across multiple operational layers:
- Wasted electricity: Idle nodes draw baseline power while waiting for master node re-orchestration.
- Checkpoint write overhead: Repeated disk writes degrade enterprise storage media over time.
- Developer downtime: Machine learning engineers pause research cycles while waiting for cluster restoration.
- SLA penalties: Delayed model deployment schedules push production releases back significantly.
These compounded costs transform minor hardware failures into massive operational losses. Organizations using reactive management constantly pay this hidden compute tax.
Silent data corruption and uncorrectable memory errors
Not all hardware failures generate clean dropouts. Silent data corruption poses an even greater risk to model integrity. High thermal stress causes subtle degradation in High Bandwidth Memory modules. When memory hardware degrades, micro-errors corrupt training gradients without crashing the hardware node right away.
Engineers may train models for days on corrupted weights before noticing divergence in validation loss curves. Discovering bad data days into a training run forces teams to roll back compute progress completely. Identifying subtle memory decay through high-frequency monitoring protects training pipelines from undetected data corruption.
Interconnect degradation and fabric bottlenecking
Modern AI infrastructure relies heavily on high-speed fabric interconnects like NVLink and InfiniBand. These physical connections maintain massive transfer speeds across distributed accelerator nodes. Physical vibration and thermal cycling degrade these delicate optical fibers over time.
As transmission links degrade, physical interfaces drop packet frames constantly. The system attempts silent packet re-transmissions to preserve data delivery. These retries create hidden network latency spikes that slow down the entire cluster. Standard uptime monitors show green status indicators because the link remains active. Meanwhile, global compute throughput drops dramatically due to underlying hardware retries.
Why standard infrastructure monitoring collapses under high-density AI clusters
Traditional data center management tools were built for web servers and basic virtual machines. These legacy tools measure metric snapshots every thirty or sixty seconds. In contrast, AI workloads generate intense transient power spikes within milliseconds. Using legacy monitoring tools on modern compute clusters creates dangerous operational blind spots.
| Monitoring Dimension | Legacy Data Center Monitoring | Predictive EONSR Telemetry |
|---|---|---|
| Telemetry Ingestion Frequency | 15 seconds to 60 seconds | Sub-second to 100 milliseconds |
| Fault Detection Method | Static threshold breaches | Multivariate anomaly detection |
| Failure Insight Target | Node outage after crash | Pre-failure silicon degradation |
| Interconnect Oversight | Basic link UP/DOWN state | Signal-to-noise ratio & bit error rates |
| Maintenance Strategy | Scheduled or post-failure swap | Dynamic automated node migration |
The flaw of static metric threshold alerts
Static thresholds assume system metrics move predictably along smooth lines. Legacy tools trigger alerts when a GPU reaches a hard limit, such as ninety degrees Celsius. However, under heavy compute loads, silicon temperatures spike within fractions of a second. By the time a static threshold fires, thermal safety throttles have already reduced clock speeds.
Thermal throttling reduces processing speeds to protect hardware components from permanent damage. This drop destabilizes clock synchronization across parallel nodes. When one node slows down, all dependent nodes pause, waiting for collective communication barriers. Static alerts fail to prevent these performance drops because they react after performance degrades.
Infrastructure teams must replace static limits with dynamic predictive baseline scoring. Tracking subtle changes in temperature curves helps teams isolate failing cooling loops long before hardware throttles.
Coarse polling intervals mask power phase fluctuations
Power distribution units experience severe stress during large model inference and training shifts. Modern GPUs shift from idle to peak wattage instantaneously. These sudden jumps create transient voltage droops across server motherboard power phases.
Standard monitoring tools average telemetry data over long polling cycles. This averaging smooths out short voltage micro-droops on monitoring dashboards. Consequently, engineers see flat line graphs despite severe underlying electrical stress. Over time, unmonitored voltage micro-droops damage onboard capacitors and cause sudden server restarts.
Capturing high-frequency power data reveals these hidden micro-droops early. Enterprise managers can then balance workload distribution across phase lines before power components fail completely.
Multivariate correlations override single-point failures
Hardware failure rarely stems from a single isolated metric failure. A server failure usually results from multiple cascading environmental pressures. For example, a minor room temperature increase combined with slight fan bearing wear causes local thermal hot spots.
Legacy monitoring treats each system metric as an independent data variable. It cannot correlate subtle temperature increases with concurrent PCIe signal retries. Predictive frameworks evaluate these interconnected metrics simultaneously to spot systemic risks. Detecting multi-metric correlation patterns allows teams to fix emerging issues early.
Understanding these subtle physical interactions empowers data center managers to act long before physical component failure occurs. Implementing predictive tax asset calculations and accounting controls helps financial controllers track the operational asset life cycle across corporate datacenters[1].
Architecting EONSR telemetry for real-time anomaly detection across silicon and fabrics
To eliminate unexpected downtime, enterprise managers need an advanced operational framework tailored for scalable compute topologies. Predictive maintenance built on continuous monitoring collects, correlates, and analyzes real-time telemetry from silicon to datacenter cooling plants. EONSR frameworks ingest multi-stream sensor outputs to calculate holistic system health scores instantly.
Sub-second telemetry ingestion and time-series streaming
High-performance monitoring starts with deep telemetry collection protocols. Modern hardware platforms expose low-level metrics via internal sensor buses. Modern monitoring agents stream these hardware metrics out continuously without introducing host CPU overhead.
Key metrics captured by real-time streaming architectures include:
- Silicon thermal gradients: Measuring temperature variations across individual accelerator cores.
- Memory ECC event counters: Tracking corrected single-bit memory faults to spot physical chip wear.
- Voltage regulator module temps: Monitoring thermal loads on board-level power conversion hardware.
- PCIe link error logs: Catching physical bus retry signals and bandwidth drops.
- Optical transceiver health: Measuring laser transmit currents and optical power levels.
Ingesting these metrics at sub-second intervals provides complete visibility into system state changes. Operations teams use this continuous data stream to track health trends across thousands of connected nodes.
Engineers seeking to optimize hardware operations must evaluate the human element in XORA AIOps to empower infrastructure teams through intelligent telemetry workflows.
Machine learning models for pre-failure anomaly scoring
Raw sensor data requires intelligent processing to produce actionable operational insights. Advanced monitoring uses lightweight machine learning models trained on historical hardware failure signatures. These models establish dynamic baseline profiles for every individual compute node in the cluster.
When current sensor inputs deviate from learned baseline patterns, the engine elevates the node's risk score. This early warning system flags degrading components days before traditional hardware checks fail. Operations teams can inspect flagged nodes during planned maintenance windows instead of dealing with sudden mid-job crashes.
The monitoring engine continuously refines its failure prediction models using live telemetry stream feedback. This active learning loop ensures anomaly detection adapts as hardware ages and workload profiles change over time.
Integrating telemetry engines with job orchestrators
Collecting health metrics provides little value if insights remain trapped on isolated operational dashboards. Predictive telemetry engines must integrate directly with cluster workload schedulers like Kubernetes or Slurm. When a node's health score drops below safety thresholds, the system triggers automated hardware protection workflows.
Automated isolation workflows execute swift protective steps:
- Cordoning degraded nodes: Preventing new workload scheduling on unstable servers.
- Proactive state checkpointing: Triggering job state saves before hardware failures occur.
- Live workload migration: Moving active compute workloads to healthy standby nodes smoothly.
- Automated diagnostic loops: Running detailed hardware diagnostics once workloads exit.
Automating these protective workflows eliminates manual intervention delays. Clusters maintain continuous operational uptime while fixing hardware issues in the background automatically.
Mitigating thermal throttling and power phase degradation before catastrophic hardware dropouts
Thermal management and power delivery form the backbone of physical AI server operations. As accelerators push past one thousand watts per socket, traditional air cooling systems reach physical performance boundaries. Liquid cooling systems introduce complex fluid dynamics and micro-channel thermal interfaces that demand strict telemetry monitoring.
Detecting liquid cooling loop failures and micro-leaks
Direct-to-chip liquid cooling systems handle high thermal loads effectively. However, liquid cooling introduces physical risks like coolant degradation, fluid flow blockages, and micro-leaks. A slight drop in coolant flow quickly causes rapid thermal buildup in dense silicon components.
High-frequency monitoring tracks pressure differentials, fluid flow rates, and supply-to-return coolant temperatures continuously. Drops in flow rates relative to pump speeds indicate clogged cold-plate channels or pump failure. Identifying these liquid flow restrictions early prevents localized overheating across server racks.
By monitoring micro-thermal gradients, operations teams flag failing cold-plates long before silicon surfaces hit thermal limits. This preventive insight protects expensive liquid-cooled accelerators from severe physical warping.
Analyzing power delivery degradation across motherboard phase lines
Modern server motherboards use multi-phase voltage regulator modules to step down high voltages into precise DC levels for processing chips. These power components face heavy thermal cycles during training workload state changes. Over time, individual power phases degrade, forcing remaining phases to carry extra current load.
Unbalanced phase loads generate local thermal hotspots on board surfaces. Continuous telemetry tracks current draw and operating temperatures across every individual power phase circuit. When one phase shows high resistance, the monitoring platform alerts engineers to schedule board servicing.
Early power phase maintenance prevents destructive short circuits across motherboard components. It protects expensive processor sockets from permanent electrical damage caused by power supply hardware failures.
Modern enterprise platforms like EON Tech leverage advanced predictive diagnostics to maintain continuous compute integrity under volatile electrical loads.
Preventing transient power surges from tripping rack circuit breakers
Large AI clusters draw massive power currents when initializing heavy matrix calculations. If thousands of accelerator cores execute complex computations simultaneously, current draws spike within microseconds. These sudden power surges can trip rack-level circuit breakers, turning off entire rows of servers instantly.
Monitoring frameworks analyze real-time power draw trends across entire rack rows simultaneously. When power consumption nears safe breaker thresholds, the monitoring system signals workload orchestrators to throttle job startup ramps slightly. Staggering compute initialization phases reduces peak power spikes without reducing long-term compute throughput.
Managing transient power demands protects data center electrical infrastructure from damage. It ensures high compute density operations remain stable within existing power distribution limits.
Balancing proactive node isolation against cluster training throughput
Implementing predictive maintenance requires balancing system stability against raw compute performance. Automatically isolating servers whenever metrics show minor variations degrades overall cluster availability. Infrastructure managers must establish precise thresholds to maximize compute uptime while protecting hardware assets.
The trade-off between false positive node isolation and cluster efficiency
Setting anomaly detection sensitivity too high causes frequent false positive alerts. Overly sensitive systems quarantine healthy compute nodes based on temporary, non-critical metric spikes. Removing working nodes unnecessarily reduces available cluster capacity and delays compute completion schedules.
Conversely, setting sensitivity limits too low allows degraded hardware to continue running active training workloads. Unchecked degraded nodes risk causing unexpected cluster crashes, resulting in severe data and compute time losses. Enterprise teams must tune detection algorithms based on historical performance metrics to optimize operational trade-offs.
The following scorecard helps infrastructure teams balance system stability against compute throughput:
| Operational Risk Level | Telemetry Signature Metrics | Automated System Action | Impact on Compute Workload |
|---|---|---|---|
| Low (Nominal Baseline) | Minor metric variations within dynamic threshold limits | Continue live telemetry collection without intervention | Zero impact; full compute throughput maintained |
| Medium (Transient Warning) | Temporary thermal spikes; isolated single-bit ECC events | Flag node for inspection; log metric deviation baseline | Zero impact; node remains active in compute pool |
| High (Pre-Failure Risk) | Corrected ECC rate increase; PCIe bus retries rising | Trigger job checkpoint save; schedule live task migration | Minimal impact; transient compute pause during job move |
| Critical (Imminent Outage) | Liquid flow drop; phase temperature limit reached | Immediate node cordon; isolate host hardware instantly | Controlled job re-route; prevents catastrophic cluster drop |
Mitigating performance degradation during live workload migrations
Migrating running deep learning jobs off degrading hardware nodes requires moving gigabytes of active memory state over network interfaces. Doing this during live job execution can temporarily congest network bandwidth for surrounding compute nodes.
Telemetry platforms coordinate state migrations during low-bandwidth network windows within training loops. Initiating live state transfers during checkpoint synchronization steps minimizes network bandwidth contention. This smart scheduling reduces performance impacts on parallel compute nodes.
Proper migration orchestration ensures stability throughout cluster repair cycles. The cluster maintains continuous compute output while replacing degrading hardware in the background smoothly.
Data center teams should explore optimizing edge performance and reliability to scale predictive operational controls across distributed deployments.
Evaluating the ROI of predictive monitoring versus traditional hardware replacement cycles
Transitioning to predictive monitoring requires up-front investments in sensor integrations, data pipelines, and analytics tools. Enterprise leadership often evaluates these software costs against traditional fixed hardware replacement budgets. However, traditional fixed-interval replacements swap out perfectly healthy hardware while missing early unexpected failures entirely.
Calculating return on investment requires measuring reduced un-planned downtime against software deployment costs. Predictive operations extend hardware operating lifespans by resolving thermal and electrical stresses before permanent damage occurs. Teams avoid premature hardware replacements while maximizing lifetime value from accelerator investments.
Additionally, avoiding major training restarts saves substantial operational energy costs over multi-year cluster deployments. Financial savings from reduced energy waste directly cover continuous monitoring platform costs.
Understanding these financial advantages helps enterprise leadership shift from reactive maintenance models to proactive operational frameworks securely.
A strategic roadmap for implementing predictive maintenance across enterprise AI data centers
Transitioning an enterprise compute environment to predictive operations requires a structured, multi-phase rollout plan. Infrastructure managers must modernize physical data capture pipelines, deploy intelligent monitoring models, and integrate automated hardware workflows step by step. Following a structured roadmap ensures operational stability throughout the system transformation.
Phase 1: Upgrading telemetry collection infrastructure
The foundation of predictive operations lies in continuous, high-speed metric collection. Organizations must audit existing server management interfaces to ensure hardware platforms support fast telemetry streaming output.
Key readiness milestones for initial telemetry deployment include:
- Updating system firmware to support out-of-band telemetry streaming protocols.
- Deploying dedicated out-of-band monitoring networks to isolate telemetry traffic from data lines.
- Setting up time-series telemetry ingest engines capable of processing millions of events per second.
- Validating baseline sensor accuracy across compute nodes, power systems, and cooling infrastructure.
Establishing reliable high-speed data pipelines ensures anomaly detection algorithms receive clean, continuous inputs. Data validation during early deployment phases prevents false alerts caused by faulty sensor calibrations.
Using verified operational accounting frameworks and audit documentation ensures full compliance with corporate enterprise asset management guidelines[1].
Phase 2: Training dynamic anomaly detection models
With telemetry pipelines active, engineers collect baseline operating data across diverse workload conditions. The system gathers sensor data during heavy model training runs, light inference processing, and idle states to build dynamic baseline profiles.
Technical teams train multivariate anomaly detection models using this baseline telemetry history. Models learn natural thermal variations and expected power fluctuations across operational environments. This baseline training phase eliminates rigid static alert thresholds that trigger false alarms.
Engineers validate model accuracy by benchmarking predictions against historic hardware maintenance logs. Adjusting sensitivity parameters ensures detection algorithms spot early hardware wear without generating excessive false positive alerts.
Phase 3: Automating job orchestration and node protection
The final implementation phase connects predictive monitoring outputs directly to job scheduling frameworks. Automating hardware protection routines removes human delay risks during critical system failure events.
Implementation steps for automated remediation include:
- Connecting health scoring APIs to job scheduling tools like Slurm or Kubernetes.
- Configuring dynamic node cordoning routines based on real-time risk scores.
- Testing automated state checkpointing and live task migration workflows under simulated fault conditions.
- Establishing automated ticketing workflows to notify hardware teams to replace flagged server components.
Automating protective workflows closes the operational loop completely. Enterprise data centers transform into self-healing processing environments ready for massive compute challenges.
Organizations should review external technical resources and industry financial compliance guides to align hardware life-cycle management with broader corporate capital plans[1].
Step-by-step decision checklist for infrastructure leadership
Before launching a predictive infrastructure transformation, operations managers should run through this core readiness checklist:
- Telemetry Infrastructure: Are server out-of-band streaming channels configured for sub-second export?
- Network Isolation: Is telemetry traffic routed over dedicated management lines to protect compute bandwidth?
- Orchestrator Integration: Can your cluster job scheduler accept automated node cordoning triggers via API?
- State Protection: Are job checkpoint routines optimized to execute rapidly without blocking network paths?
- Maintenance Workflows: Are hardware technician teams prepared to handle proactive, pre-failure component swaps?
Completing these preparation steps ensures enterprise compute infrastructure remains highly resilient, cost-effective, and fully optimized for future demands.
More Information
- Predictive Maintenance: A proactive strategy using real-time telemetry and analytics to anticipate hardware degradation, allowing repairs before catastrophic failure occurs[1].
- EONSR Monitoring: A continuous telemetry ingestion framework that processes microsecond-level hardware metrics to score operational risk across dense compute clusters[2].
- Thermal Throttling: An automated safety mechanism where processors reduce operating frequency to lower heat production, preventing permanent hardware burnout[3].
- Silent Data Corruption: Unnoticed data errors caused by hardware degradation that corrupt memory or compute output without triggering immediate system crashes[4].
- PCIe Bus Retry: A hardware recovery event where physical data buses re-transmit lost data packets, introducing hidden latency spikes across compute fabrics[5].